
How to use Charts in Microsoft Excel in Office 365
Microsoft Excel is a popular ‘Spreadsheet’ program from Microsoft. When it comes to understanding numbers, charts are the best option to interpret instead of volumes of numbers/data.
According to Wikipedia – A chart is a graphical representation for data visualization, in which “the data is represented by symbols, such as bars in a bar chart, lines in a line chart, or slices in a pie chart”. A chart can represent tabular numeric data, functions or some kinds of quality structure and provides different info. Let us start straight away with the process. For the demonstration purposes, we have used sample data to explain different types of charts. You can change this sample data as per your requirement.
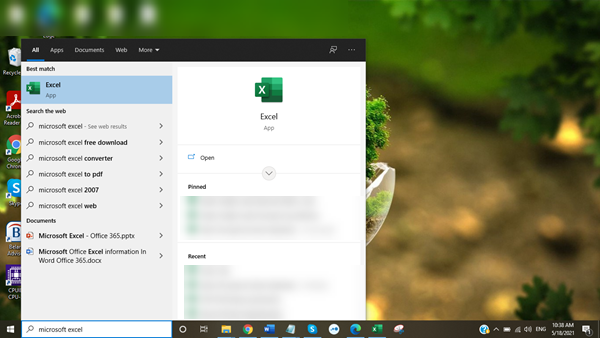
Step 1: Go to the ‘Start’ menu of your computer and search ‘microsoft excel’ as shown in the image below. Click on the app to open.
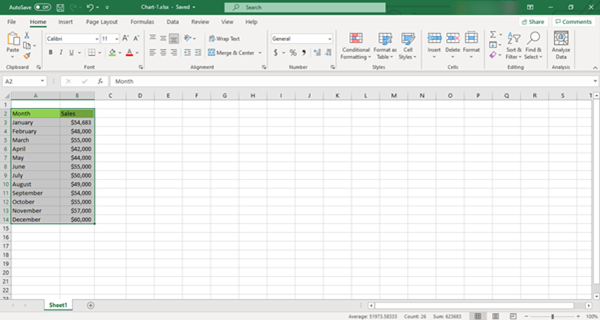
Step 2: A new blank excel sheet will open. Enter the data as desired (sample data) and save the file. There are different methods to insert chart from the data. We will first discuss the context menu -> ‘Quick Analysis’ option. For this, first select the data range you want to use to display in chart.
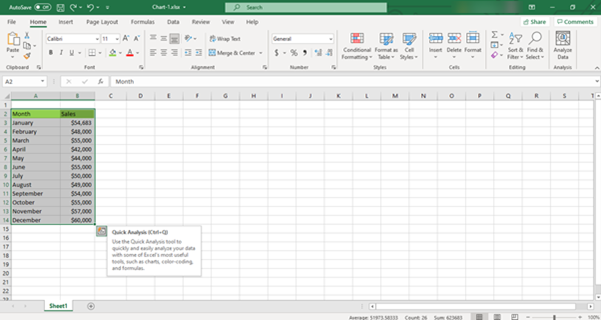
Step 4: When you select two or more cells (data range), Microsoft Excel prompts ‘Quick Analysis’ tool (as shown in the image below).
Step 5: When you click on ‘Quick Analysis’, Office 365 Microsoft Excel prompts you with different options like – Charts, Color-Coding, Formulas etc. From the menu select ‘Charts’.
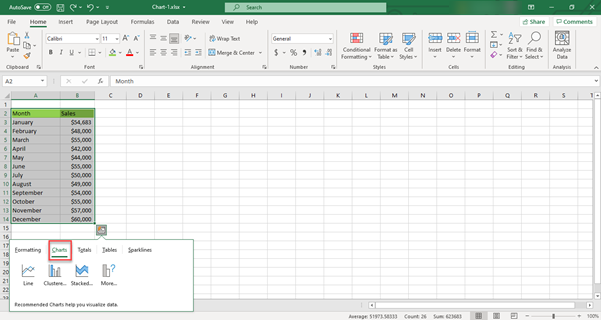
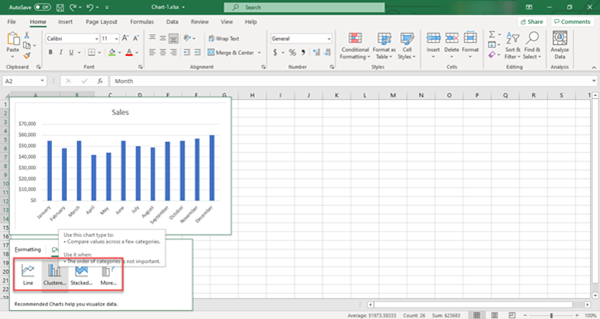
Step 6: When you click on the ‘Charts’ option – you will find recommended chart types – Line, Clustered Column, Stacked Area, and Pie. Hove over each chart type to see a preview of the proposed chart.
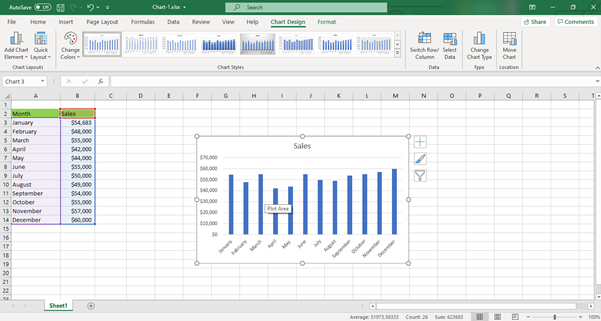
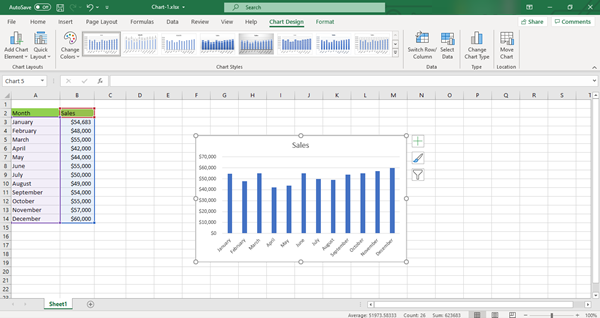
Step 7: For this example, we selected the ‘Clustered Column’ chart type. The chart is visible in the vacant area of the sheet, as shown in the image below. You can also customize the appearance of the chart from the ‘Chart Design’ menu. The options in the ‘Chart Design’ menu change with the change in the char type i.e. If a Line chart is selected, the layouts will be for the Line chart; if a Pie chart is selected, the layouts will pertain to the same.
The second way to insert a chart in a Microsoft Excel sheet is using the ‘Insert’ menu. For this, select the desired data range and follow the following steps –
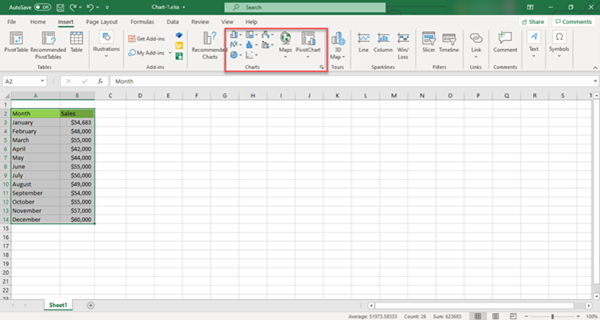
Step 1: After selecting the data, click on the ‘Insert’ menu.
Step 2: You will see various chart types, as highlighted in the image below. First, we will select the ‘Pie Chart’ type.
Now we will discuss different Chart types available in Office 365 Excel, which are commonly used –
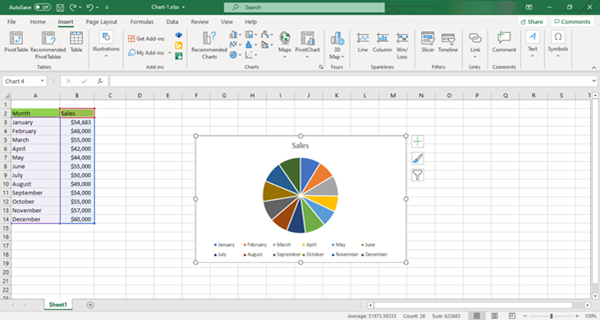
Pie Chart:
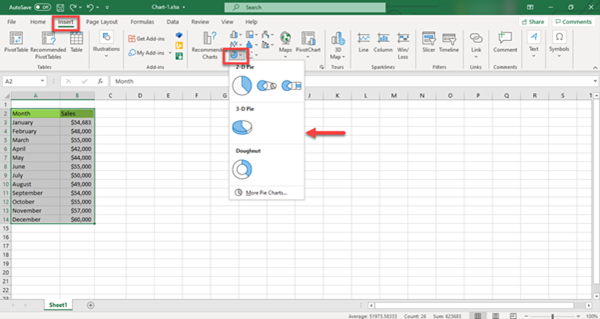
Step 1: To insert ‘Pie Chart’, select the ‘Pie or Doughnut Chart’ option as shown in the image. You can hover over different options to preview the chart and then click on the desired chart layout.
Step 2: Once the chart is inserted, you can drag it to any cell (row/column) or even move/copy it to a separate sheet, as desired.
Bar Chart:
Step 1: Repeat the steps for Pie chart, and now select the ‘Column or Bar Chart’ from the ‘Insert’ -> ‘Chart’, as shown in the image. You can hover over the different layouts to preview and then click on the desired layout.
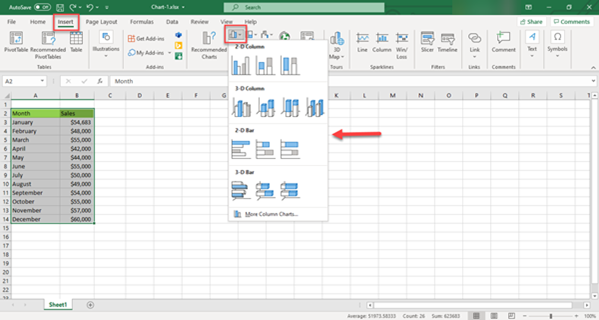
Step 2: Once the desired layout is selected, you can move the chart generated as desired.
Line Chart:
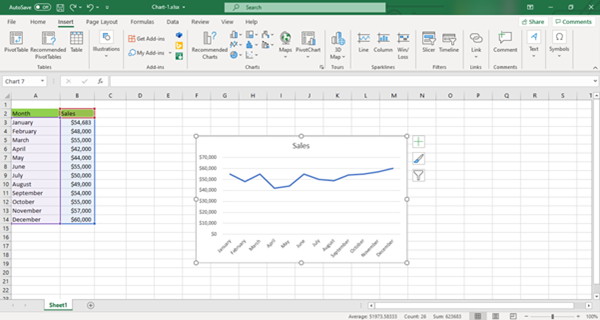
Step 1: To insert a Line Chart, select the data range, and from the ‘Insert’ menu -> ‘Chart’, select ‘Line or Area Chart’ as shown in the image below. As earlier, preview the different layouts and then select the desired layout to insert the chart.
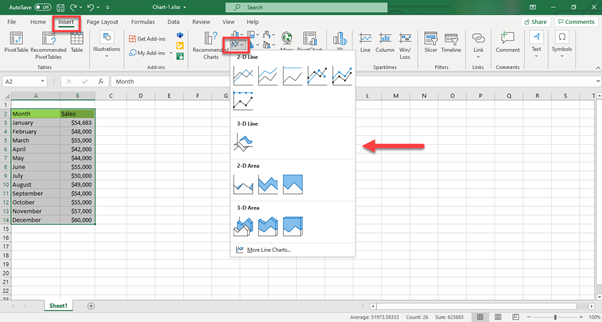
Step 2: Once the chart is inserted you can modify the same as desired.
Microsoft Excel charts are dynamic in nature – any change in the data range will automatically update the chart. There is no need to explicitly refreshing the chart to reflect the changes in the data.
 (1)")